Production And
Operation Management
SIX SIGMA
WHAT IS SIGMA ?
 A term (Greek) used in statistics to
represent standard deviation from mean
value, an indicator of the degree of variation
in a set of a process.
 Sigma measures how far a given process
deviates from perfection. Higher sigma
capability, better performance
What is Six Sigma?
 Six Sigma is a disciplined, data-driven approach and
methodology for eliminating defects (driving
toward six standard deviations between the mean and the
nearest specification limit) in any process – from
manufacturing to transactional and from product to
service.
 Wise application of statistical tools within a structured
methodology
 Repeated application of strategy to individual projects
What is Six Sigma?
 In 1986, Bill Smith, a senior engineer and scientist at
Motorola, introduced the concept of Six Sigma to
standardize the way defects are counted.
 Six Sigma provided Motorola the key to addressing quality
concerns throughout the organization, from manufacturing to
support functions. The application of Six Sigma also
contributed to Motorola winning the Malcolm Baldrige
National Quality award in 1988.
 Since then, the impact of the Six Sigma process on
improving business performance has been dramatic and well
documented by other leading global organizations, such as
General Electric, Allied Signal, and Citibank.
Six Sigma
Methods Production
Design
Service
Purchase
HRM
Administration
Quality
Depart.
Management
IT
Where can Six Sigma be applied?
WHY SIX SIGMA ?
 Six Sigma emerged as a natural evolution in
business to increase profit by eliminating
defects
 The Current business environment now
demands and rewards innovation more than ever
before due to:
 Customer Expectations
 Technological Change
 Global Competition
Sigma Levels Screenshot_2015-03-09-18-13-38.png
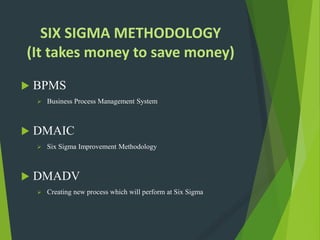
SIX SIGMA METHODOLOGY
(It takes money to save money)
 BPMS
 Business Process Management System
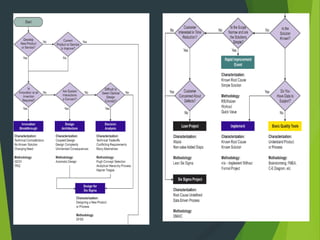
 DMAIC
 Six Sigma Improvement Methodology
 DMADV
 Creating new process which will perform at Six Sigma
BUSINESS PROCESS MANAGEMENT
SYSTEM
 BPM strategies emphasize on process
improvement and automation to derive
performance.
 Combining BPM strategies with sigma
six is most powerful way to improve
performance.
 Both strategies are not mutually
exclusive but some companies produced
dramatic results by combining them.
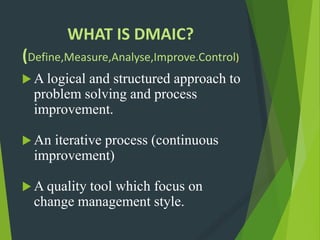
WHAT IS DMAIC?
(Define,Measure,Analyse,Improve.Control)
 A logical and structured approach to
problem solving and process
improvement.
 An iterative process (continuous
improvement)
 A quality tool which focus on
change management style.
PHASES
Phases of Six Sigma are:
 Define specific goals to
achieve outcomes, consistent
with customers demand and
business strategy
 Measure reduction of defects
 Analyze problems ,cause and
effects must be considered
 Improve process on bases of
measurements and analysis
 Control process to minimize
defects
WHAT IS DMADV?
 Acronym for:
 Define the project
 Measure the opportunity
 Analyze the process options
 Design the process
 Verify the performance
TOOLS & TECHNIQUES
 7QC tools
 Check Sheets (collect data to make
improvements)
 Pareto Charts( define problem and frequency)
 Cause and effect diagram (Identify possible
causes to solve problem)
 Histogram (Bar charts of accumulated data to
evaluate distribution of data)
 Scatter diagram (plots many data points and
pattern between two variables)
 Flow Chart (Identify unwanted steps)
 Control charts (Control limits around mean
value)
Pareto chart
( define problem and frequency)
 A pareto chart is used to graphically summarize and
display the relative importance of the differences
between groups of data.
What Questions the Pareto
Chart Answers
 What are the largest issues facing our team or
business?
 What 20 percent of sources are causing 80 percent
of the problems (80/20 Rule)?
80/20 Rule Applications
• 80 percent of process defects arise from 20 percent of the
process issues.
• 20 percent of your sales force produces 80 percent of your
company revenues.
• 80 percent of customer complaints arise from 20 percent of
your products or services.
Cause and effect diagram
(Identify possible causes to solve problem)
 It is particularly useful in a group setting
and for situations in which little
quantitative data is available for analysis.
Histogram
(Bar charts of accumulated data to
evaluate distribution of data)
 histogram is used to graphically summarize and
display the distribution of a process data set.
What Questions the Histogram
Answers
 What is the most common system response?
 What distribution (centre , variation and shape)
does the data have?
 Does the data look symmetric or is it skewed to
the left or right?
Scatter diagram
(plots many data points and pattern
between two variables)
 A scatter plot, also called a
scatter diagram or a , is a
basic graphic tool that
illustrates the relationship
between two variables.
 It is a tool used to visually
determine whether a
potential relationship exists
between an input and an
outcome.
Flow Chart
(Identify unwanted steps)
 A flowchart is a type of diagram that
represents an algorithm, workflow or process,
showing the steps as boxes of various kinds, and
their order by connecting them with arrows.
This diagrammatic representation illustrates a
solution model to a given problem.
 It represents the entire process from start to
finish
Flow Chart Symbol
Control charts
(Control limits around mean value)
 Control charts have two general uses in an
improvement project.
 The most common application is as a tool to monitor
process stability and control.
KEY ROLES FOR SIX SIGMA
Six Sigma identifies several key roles for
its successful implementation:
 Executive leadership
 Champions
 Master Black Belts (Identify projects&
functions)
 Black Belts (Identify non value added
activities)
 Green Belts ( works on small projects )
Top
Bottom
Six Sigma Certificate
USAGE OF SIX SIGMA
Six Sigma Companies
Six Sigma and Financial
Services