어플리케이션 성능튜닝 교육
지앤클라우드 송상욱
성능측정
고려사항: TPS (Transaction / Throughput)
1. CPU 사용률이 높다 => 코드 리팩토링
2. CPU 사용률이 낮다 => 블로킹 ( 쓰레드 / IO )
3. 메모리 사용률이 높다.
a. OOM발생 => 메모리릭
b. GC가 빈번 => 코드 리팩토링 (메모리 재사용)
c. Full GC 시 어플리케이션 정지
i. 메모리를 높인다.
ii. 메모리를 낮춘다.
iii. GC 종류를 변경한다.
자바(톰캣) 성능튜닝 고려사항
1. memory usage
2. garbage collection
3. thread usage
4. request throughout
5. number of sessions
6. response time
7. database connection pool
8. error rates
9. uptime
GC
가비지컬렉션 프로세스
https://www.oracle.com/webfolder/technetwork/tutorials/obe/java/gc01/index.html
> Describing Garbage Collection
> The Generational Garbage Collection Process
G1GC
● MaxGCPauseMillis 플래그로 G1의 일시 중지 시간 목표를 설정
● G1은 예측 모델을 사용하여 해당 목표 일시 중지 시간 내에 가비지 수집 작업의 양을 결정
● 컬렉션이 끝나면 G1은 다음 컬렉션 (컬렉션 집합)에서 수집 할 영역을 선택
● MaxGCPauseMillis의 기본값은 200 밀리 초
-XX:-
UseConcMarkSweepGC
Use concurrent mark-sweep collection for the old generation. (Introduced in 1.4.1)
-
XX:+UseGCOverheadLimit
Use a policy that limits the proportion of the VM's time that is spent in GC before an OutOfMemory error is thrown. (Introduced in 6.)
-
XX:+UseLWPSynchronizati
on
Use LWP-based instead of thread based synchronization. (Introduced in 1.4.0. Relevant to Solaris only.)
-XX:-UseParallelGC Use parallel garbage collection for scavenges. (Introduced in 1.4.1)
-XX:-UseParallelOldGC Use parallel garbage collection for the full collections. Enabling this option automatically sets -XX:+UseParallelGC. (Introduced in 5.0 update
6.)
-XX:-UseSerialGC Use serial garbage collection. (Introduced in 5.0.)
Java -XX GC Options
Option and Default Value Description
-XX:+UseG1GC Use the Garbage First (G1) Collector
-XX:MaxGCPauseMillis=n Sets a target for the maximum GC pause time. This is a soft goal, and the JVM will make its best effort
to achieve it.
-XX:InitiatingHeapOccupancyPercent=n Percentage of the (entire) heap occupancy to start a concurrent GC cycle. It is used by GCs that
trigger a concurrent GC cycle based on the occupancy of the entire heap, not just one of the
generations (e.g., G1). A value of 0 denotes 'do constant GC cycles'. The default value is 45.
-XX:NewRatio=n Ratio of old/new generation sizes. The default value is 2.
-XX:SurvivorRatio=n Ratio of eden/survivor space size. The default value is 8.
-XX:MaxTenuringThreshold=n Maximum value for tenuring threshold. The default value is 15.
-XX:ParallelGCThreads=n Sets the number of threads used during parallel phases of the garbage collectors. The default value
varies with the platform on which the JVM is running.
-XX:ConcGCThreads=n Number of threads concurrent garbage collectors will use. The default value varies with the platform on
which the JVM is running.
-XX:G1ReservePercent=n Sets the amount of heap that is reserved as a false ceiling to reduce the possibility of promotion failure.
The default value is 10.
-XX:G1HeapRegionSize=n With G1 the Java heap is subdivided into uniformly sized regions. This sets the size of the individual
sub-divisions. The default value of this parameter is determined ergonomically based upon heap size.
The minimum value is 1Mb and the maximum value is 32Mb.
Command Options* Resulting Collector Combination
-XX:+UseSerialGC young Copy and old MarkSweepCompact
-XX:+UseG1GC young G1 Young and old G1 Mixed
-XX:+UseParallelGC -XX:+UseParallelOldGC -XX:+UseAdaptiveSizePolicy young PS Scavenge old PS MarkSweep with adaptive sizing
-XX:+UseParallelGC -XX:+UseParallelOldGC -XX:-UseAdaptiveSizePolicy young PS Scavenge old PS MarkSweep, no adaptive sizing
-XX:+UseParNewGC (deprecated in Java 8 and removed in Java 9 - for ParNew see the line
below which is NOT deprecated)
young ParNew old MarkSweepCompact
-XX:+UseConcMarkSweepGC -XX:+UseParNewGC young ParNew old ConcurrentMarkSweep**
-XX:+UseConcMarkSweepGC -XX:-UseParNewGC (deprecated in Java 8 and removed in Java
9)
young Copy old ConcurrentMarkSweep**
*All the combinations listed here will fail to let the JVM start if you add another GC algorithm not listed, with the exception of -XX:+UseParNewGC which is only combinable
with -XX:+UseConcMarkSweepGC
Combinations of Garbage Collectors
-XX:HeapDumpPath=./java_pid<pid>.hprof Path to directory or filename for heap dump. Manageable. (Introduced in 1.4.2 update 12, 5.0 update 7.)
-XX:-HeapDumpOnOutOfMemoryError Dump heap to file when java.lang.OutOfMemoryError is thrown. Manageable. (Introduced in 1.4.2 update 12, 5.0 update 7.)
-XX:OnError="<cmd args>;<cmd args>" Run user-defined commands on fatal error. (Introduced in 1.4.2 update 9.)
-XX:OnOutOfMemoryError="<cmd args>;
<cmd args>"
Run user-defined commands when an OutOfMemoryError is first thrown. (Introduced in 1.4.2 update 12, 6)
-XX:-PrintClassHistogram Print a histogram of class instances on Ctrl-Break. Manageable. (Introduced in 1.4.2.) The jmap -histo command provides equivalent functionality.
-XX:-PrintConcurrentLocks Print java.util.concurrent locks in Ctrl-Break thread dump. Manageable. (Introduced in 6.) The jstack -l command provides equivalent functionality.
-XX:-PrintCommandLineFlags Print flags that appeared on the command line. (Introduced in 5.0.)
-XX:-PrintCompilation Print message when a method is compiled.
-XX:-PrintGC Print messages at garbage collection. Manageable.
-XX:-PrintGCDetails Print more details at garbage collection. Manageable. (Introduced in 1.4.0.)
-XX:-PrintGCTimeStamps
Java -XX Debugging Options
Tomcat
톰캣 Server.xml
● connectionTimeout="5000" - 기본 20초로 설정됨.
● keepAliveTimeout=”5000” - 기본 connectionTimeout 과 동일하게 설정됨.
● minSpareThreads="25" - 항상 실행되는 최소 스레드 수
● maxThreads="200" - 작업스레드 수
● acceptCount="100" - 요청 큐 최대길이
● disableUploadTimeout="true"
● maxConnections="8192" - 최대연결
● enableLookups=”false” - DNS lookup
● compression="off" - 메시지 압축
● tcpNoDelay="true" - 버퍼가 차기전에 바로 전송
https://tomcat.apache.org/tomcat-8.5-doc/config/http.html
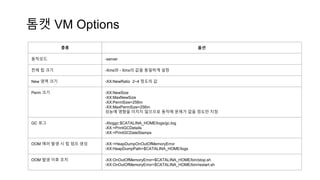
종류 옵션
동작모드 -server
전체 힙 크기 -Xms와 - Xmx의 값을 동일하게 설정
New 영역 크기 -XX:NewRatio 2~4 정도의 값
Perm 크기 -XX:NewSize
-XX:MaxNewSize
-XX:PermSize=256m
-XX:MaxPermSize=256m
성능에 영향을 미치지 않으므로 동작에 문제가 없을 정도만 지정
GC 로그 -Xloggc:$CATALINA_HOME/logs/gc.log
-XX:+PrintGCDetails
-XX:+PrintGCDateStamps
OOM 에러 발생 시 힙 덤프 생성 -XX:+HeapDumpOnOutOfMemoryError
-XX:HeapDumpPath=$CATALINA_HOME/logs
OOM 발생 이후 조치 -XX:OnOutOfMemoryError=$CATALINA_HOME/bin/stop.sh
-XX:OnOutOfMemoryError=$CATALINA_HOME/bin/restart.sh
톰캣 VM Options
디버깅
JDWP
java -Xdebug -
Xrunjdwp:transport=dt_socket,address=8000,server=y,suspend=y Test
옵션 :
- transport=dt_shmem (using shared memory). 동일머신에서만 사용가능.
JDWP = Java Debug Wire Protocol
Java tools
Standard JDK Tools and Utilities
● Basic Tools (appletviewer, extcheck, jar, java, javac, javadoc, javah, javap, jdb, jdeps)
● Security Tools (keytool, jarsigner, policytool, kinit, klist, ktab)
● Internationalization Tools (native2ascii)
● Remote Method Invocation (RMI) Tools (rmic, rmiregistry, rmid, serialver)
● Java IDL and RMI-IIOP Tools (tnameserv, idlj, orbd, servertool)
● Java Deployment Tools (javapackager, pack200, unpack200)
● Java Web Start Tools (javaws)
● Java Troubleshooting, Profiling, Monitoring and Management Tools (jcmd, jconsole, jmc, jvisualvm)
● Java Web Services Tools (schemagen, wsgen, wsimport, xjc)
● Monitoring Tools (jps, jstat, jstatd)
● Troubleshooting Tools (jinfo, jhat, jmap, jsadebugd, jstack)
HPROF profiler
Writes class profiling information to a file or a socket, in ASCII or binary.
● Heap allocation profiling.
● Heap dump.
● CPU usage - for threads, methods.
● Monitor contention profiling.
To invoke the HPROF tool: java -agentlib:hprof ToBeProfiledClass
To print the complete list of options: java -agentlib:hprof=help
jhat
Parse a binary heap dump, launch a web browser, and present standard queries.
● Execute standard queries, for example, classes, objects, class instances, reference chains from
object rootset, reachable objects, and more.
● Turn on or off object allocation tracking.
● Turn on or off object reference tracking.
● Specify objects to exclude from "reachable objects" query.
● Pass flags to the Java VM on which jhat is running.
● Develop custom queries with buit-in Object Query Language.
● Compare objects in two dumps.
jmap
● Print shared object mappings for a process, a core file, or a remote debug server.
● Dump the Java heap (all objects or only live objects) of a process, a core file, or a remote debug
server in binary format to a file.
● Force the Java heap dump of a process if the process does not respond.
● Print a heap summary for a process, a core file, or a remote debug server.
● Print a histogram (all objects or only live objects) of a process, a core file, or a remote debug server.
● Print information on objects awaiting finalization.
● Print class loader statistics of the permanent generation.
● Pass flags to the VM
jstack
● Print stack traces of threads for a process, core file, or remote debug server
● Print information about concurrent locks for a process, core file, or remote debug server
● Force the stack dump for a process if the process does not respond
jstat
jstat -gc -h10 15994 1000
Monitors Java Virtual Machine (JVM) statistics.
-class
-compiler
-gc
-gccapacity
-gccause
-gcmetacapacity
-gcnew
-gcnewcapacity
-gcold
-gcoldcapacity
-gcutil
-printcompilation
jvisualvm
https://htmlpreview.github.io/?https://raw.githubusercontent.com/visualvm/visualvm.java.net.ba
ckup/master/www/ko_KR/gettingstarted.html
패스트캣 쉘스크립트
fastcatsearch.sh
#!/bin/bash
[...중략..]
# PROFILE
PROFILE_AGENT_LINUX_X86_32=$server_home/bin/profile/yourkit/bin/linux-x86-
32/libyjpagent.so
PROFILE_AGENT_LINUX_X86_64=$server_home/bin/profile/yourkit/bin/linux-x86-
64/libyjpagent.so
PROFILE_AGENT_WIN32=$server_home/bin/profile/yourkit/bin/win32/yjpagent.dll
PROFILE_AGENT_WIN64=$server_home/bin/profile/yourkit/bin/win64/yjpagent.dll
PROFILE_AGENT=PROFILE_AGENT_LINUX_X86_64
PROFILE_PORT=10001
fastcatsearch.sh (이어서)
JVM_OPTS="-Xms$heap_memory_size -Xmx$heap_memory_size -XX:+HeapDumpOnOutOfMemoryError"
JAVA_OPTS="-server -Dorg.jboss.netty.epollBugWorkaround=true -Dfile.encoding=UTF-8 -
Dlogback.configurationFile=$CONF/logback.xml -Dderby.stream.error.file=$LOGS/db.log -
Duser.timezone=Asia/Seoul"
DEBUG_OPT="-agentlib:jdwp=transport=dt_socket,suspend=n,server=y,address=59090"
PROFILE_OPT_JMX="-verbosegc -XX:+PrintGCDetails -Dcom.sun.management.jmxremote"
PROFILE_OPT="-agentpath:$PROFILE_AGENT=port=$PROFILE_PORT
실습(시연)
자바프로세스를 프로파일링 모드로 띄우고 프로파일 도구로 붙어서 점검
visualvm 또는 yourkit