Chapter 7
Analyzing System Process
Requirements
Modern Systems Analysis
and Design
© 2011 Pearson Education, Inc. 2Chapter 7
Learning Objectives
 Understand the logical modeling of processes by
studying examples of data flow diagrams
(DFDs).
 Draw data flow diagrams following specific rules
and guidelines that lead to accurate and well-
structured process models.
 Decompose data flow diagrams into lower-level
diagrams.
 Balance higher-level and lower-level data flow
diagrams.
© 2011 Pearson Education, Inc. 3Chapter 7
Learning Objectives (Cont.)
 Use data flow diagrams as a tool to
support the analysis of information
systems.
 Discuss process modeling for electronic
commerce applications.
 Use decision tables to represent the logic
of choice in conditional statements.
© 2011 Pearson Education, Inc.
Process Modeling
4Chapter 7
FIGURE 7-1
Systems development life cycle with the analysis phase highlighted
© 2011 Pearson Education, Inc. 5Chapter 7
Process Modeling (Cont.)
 Graphically represent the processes
that capture, manipulate, store, and
distribute data between a system and
its environment and among system
components.
© 2011 Pearson Education, Inc. 6Chapter 7
Process Modeling (Cont.)
 Utilize information gathered during
requirements determination.
 Processes and data structures are
modeled.
© 2011 Pearson Education, Inc. 7Chapter 7
Deliverables and Outcomes
 Context data flow diagram (DFD)
Scope of system
 DFDs of current physical system
Adequate (enough) detail only
 DFDs of current logical system
Enables analysts to understand current
system
© 2011 Pearson Education, Inc. 8Chapter 7
Deliverables and Outcomes (Cont.)
 DFDs of new logical system
Technology independent
Show data flows, structure, and
functional requirements of new system
 Thorough description of each DFD
component
© 2011 Pearson Education, Inc. 9Chapter 7
Data Flow Diagramming
Mechanics
 Represent both physical and logical
information systems
 Only four symbols are used
© 2011 Pearson Education, Inc. 10Chapter 7
Data Flow Diagramming
Mechanics (Cont.)
 Useful for depicting purely logical
information flows
 DFDs that detail physical systems
differ from system flowcharts which
depict details of physical computing
equipment
© 2011 Pearson Education, Inc. 11Chapter 7
Definitions and Symbols
FIGURE 7-2
Comparison of DeMarco
and Yourdon and Gane
and Sarson DFD symbol
sets
© 2011 Pearson Education, Inc. 12Chapter 7
Definitions and Symbols (Cont.)
 Process: work or actions performed
on data (inside the system)
 Data store: data at rest (inside the
system)
© 2011 Pearson Education, Inc. 13Chapter 7
Definitions and Symbols (Cont.)
 Source/sink: external entity that is
origin or destination of data (outside
the system)
 Data flow: arrows depicting
movement of data
© 2011 Pearson Education, Inc.
Developing DFDs
 Context diagram is an overview of an
organizational system that shows:
the system boundaries.
external entities that interact with the system.
major information flows between the entities
and the system.
Note: only one process symbol, and no data
stores shown
14Chapter 7
© 2011 Pearson Education, Inc.
Context Diagram
15Chapter 7
FIGURE 7-4
Context diagram of Hoosier Burger’s food-ordering system
© 2011 Pearson Education, Inc.
Developing DFDs (Cont.)
 Level-0 diagram is a data flow diagram
that represents a system’s major
processes, data flows, and data stores at
a high level of detail.
Processes are labeled 1.0, 2.0, etc. These will
be decomposed into more primitive (lower-
level) DFDs.
16Chapter 7
© 2011 Pearson Education, Inc.
Level-0 Diagram
17Chapter 7
FIGURE 7-5
Level-0 DFD of Hoosier Burger’s
food-ordering system
© 2011 Pearson Education, Inc. 18Chapter 7
Data Flow Diagramming Rules
 There are two DFD guidelines that apply:
The inputs to a process are different from the
outputs of that process.
 Processes purpose is to transform inputs into
outputs.
Objects on a DFD have unique names.
 Every process has a unique name.
© 2011 Pearson Education, Inc.
Data Flow Diagramming Rules (Cont.)
19Chapter 7
TABLE 7-2 Rules Governing Data Flow Diagramming
© 2011 Pearson Education, Inc.
Data Flow Diagramming Rules (Cont.)
20Chapter 7
TABLE 7-2 Rules Governing Data Flow Diagramming (cont.)
© 2011 Pearson Education, Inc. 21Chapter 7
Decomposition of DFDs
 Functional decomposition is an iterative
process of breaking a system description
down into detail.
Creates a set of charts in which one process
on a given chart is explained in greater detail
on another chart.
Continues until no sub-process can logically
be broken down any further.
© 2011 Pearson Education, Inc. 22Chapter 7
Decomposition of DFDs (Cont.)
 Primitive DFD is the lowest level of a DFD.
 Level-1 diagram results from
decomposition of Level-0 diagram.
 Level-n diagram is a DFD diagram that is
the result of n nested decompositions from
a process on a level-0 diagram.
© 2011 Pearson Education, Inc. 23Chapter 7
Level-1 DFD
Level-1 DFD shows
the sub-processes
of one of the
processes in the
Level-0 DFD.
This is a Level-1
DFD for Process
4.0.
Processes are labeled 4.1, 4.2, etc.
These can be further decomposed
in more primitive (lower-level)
DFDs if necessary.
FIGURE 7-8
Level-1 diagram showing the decomposition
of Process 4.0 from the level-0 diagram for
Hoosier Burger’s food-ordering system
© 2011 Pearson Education, Inc. 24Chapter 7
Level-n DFD
Level-n DFD shows
the sub-processes
of one of the
processes in the
Level n-1 DFD.
This is a Level-2
DFD for Process
4.3.
Processes are labeled 4.3.1, 4.3.2, etc. If this is the lowest level of the
hierarchy, it is called a primitive DFD.
FIGURE 7-9
Level-2 diagram showing the decomposition of
Process 4.3 from the level-1 diagram for Process
4.0 for Hoosier Burger’s food-ordering system
© 2011 Pearson Education, Inc. 25Chapter 7
Balancing DFDs
 Conservation Principle: conserve
inputs and outputs to a process at the
next level of decomposition
 Balancing: conservation of inputs and
outputs to a data flow diagram process
when that process is decomposed to a
lower level
© 2011 Pearson Education, Inc. 26Chapter 7
Balancing DFDs (Cont.)
 Balanced means:
Number of inputs to lower level DFD
equals number of inputs to associated
process of higher-level DFD
Number of outputs to lower level DFD
equals number of outputs to associated
process of higher-level DFD
© 2011 Pearson Education, Inc. 27Chapter 7
Balancing DFDs (Cont.)
This is
unbalanced
because the
process of the
context diagram
has only one
input but the
Level-0 diagram
has two inputs.
1 input
1 output
2 inputs
1 output
FIGURE 7-10 An unbalanced set of data flow diagrams
(a) Context diagram
(b) Level-0 diagram
© 2011 Pearson Education, Inc. 28Chapter 7
Balancing DFDs (Cont.)
 Data flow splitting is when a
composite data flow at a higher level is
split and different parts go to different
processes in the lower level DFD.
 The DFD remains balanced because the
same data is involved, but split into two
parts.
© 2011 Pearson Education, Inc.
Balancing DFDs (Cont.)
29Chapter 7
FIGURE 7-11
Example of data flow splitting
(a) Composite data flow
(b) Disaggregated data flows
© 2011 Pearson Education, Inc. 30Chapter 7
Balancing DFDs: More DFD Rules
© 2011 Pearson Education, Inc. 31Chapter 7
Four Different Types of DFDs
 Current Physical
 Process labels identify technology (people or
systems) used to process the data.
 Data flows and data stores identify actual name of the
physical media.
 Current Logical
 Physical aspects of system are removed as much as
possible.
 Current system is reduced to data and processes that
transform them.
© 2011 Pearson Education, Inc. 32Chapter 7
Four Different Types of DFDs
(Cont.)
 New Logical
Includes additional functions.
Obsolete functions are removed.
Inefficient data flows are reorganized.
 New Physical
Represents the physical implementation of
the new system.
© 2011 Pearson Education, Inc. 33Chapter 7
Guidelines for Drawing DFDs
 Completeness
DFD must include all components necessary
for system.
Each component must be fully described in
the project dictionary or CASE repository.
 Consistency
The extent to which information contained on
one level of a set of nested DFDs is also
included on other levels
© 2011 Pearson Education, Inc. 34Chapter 7
Guidelines for Drawing DFDs
(Cont.)
 Timing
Time is not represented well on DFDs.
 Iterative Development
Analyst should expect to redraw diagram
several times before reaching the closest
approximation to the system being modeled.
© 2011 Pearson Education, Inc. 35Chapter 7
Guidelines for Drawing DFDs
(Cont.)
 Primitive DFDs
Lowest logical level of decomposition
Decision has to be made when to stop
decomposition
© 2011 Pearson Education, Inc. 36Chapter 7
Guidelines for Drawing DFDs
(Cont.)
 Rules for stopping decomposition
When each process has been reduced
to a single decision, calculation or
database operation
When each data store represents data
about a single entity
© 2011 Pearson Education, Inc. 37Chapter 7
Guidelines for Drawing DFDs
(Cont.)
 Rules for stopping decomposition, cont.
When the system user does not care to
see any more detail
When every data flow does not need to
be split further to show that data are
handled in various ways
© 2011 Pearson Education, Inc. 38Chapter 7
Guidelines for Drawing DFDs
(Cont.)
 Rules for stopping decomposition, cont.
When you believe that you have shown
each business form or transaction,
online display and report as a single
data flow
When you believe that there is a
separate process for each choice on all
lowest-level menu options
© 2011 Pearson Education, Inc. 39Chapter 7
Using DFDs as Analysis Tools
 Gap Analysis is the process of
discovering variance between two or more
sets of DFD or variance within a single
DFD.
 Inefficiencies in a system can often be
identified through DFDs.
© 2011 Pearson Education, Inc.
Using DFDs in Business
Process Re-Engineering BPR
40Chapter 7
FIGURE 7-16
IBM Credit Corporation’s primary work process before BPR
(Source: Based on Hammer and Champy, 1993.)
© 2011 Pearson Education, Inc.
Using DFDs in BPR (Cont.)
41Chapter 7
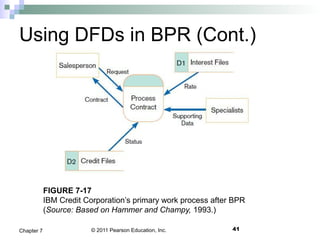
FIGURE 7-17
IBM Credit Corporation’s primary work process after BPR
(Source: Based on Hammer and Champy, 1993.)
© 2011 Pearson Education, Inc. 42Chapter 7
Modeling Logic with Decision
Tables
 Decision table: a matrix representation of
the logic of a decision which specifies the
possible conditions for the decision and
the resulting actions.
 Best used for complicated decision logic.
© 2011 Pearson Education, Inc. 43Chapter 7
Modeling Logic with Decision
Tables (Cont.)
FIGURE 7-18
Complete decision table for payroll system example
Employee Type: “S,”
stands for salaried, and
“H,” which stands for
hourly
© 2011 Pearson Education, Inc. 44Chapter 7
Modeling Logic with Decision
Tables (Cont.)
 Condition stubs: that part of a decision
table that lists the conditions relevant to
the decision
 Action stubs: that part of a decision table
that lists the actions that result for a given
set of conditions
© 2011 Pearson Education, Inc. 45Chapter 7
Modeling Logic with Decision
Tables (Cont.)
 Rules: that part of a decision table that
specifies which actions are to be followed
for a given set of conditions
 Indifferent condition: in a decision table,
a condition whose value does not affect
which actions are taken for two or more
rules
© 2011 Pearson Education, Inc. 46Chapter 7
Modeling Logic with Decision
Tables (Cont.)
 Procedure for Creating Decision Tables
Name the condition and the values that each
condition can assume.
Name all possible actions that can occur.
List all possible rules.
Define the actions for each rule.
Simplify the table.
© 2011 Pearson Education, Inc. 47Chapter 7
Modeling Logic with Decision
Tables (Cont.)
FIGURE 7-19
Reduced decision table for payroll system example
© 2011 Pearson Education, Inc.
Electronic Commerce Application: Process
Modeling using Data Flow Diagrams
48Chapter 7
FIGURE 7-22
Level-0 data flow
diagram for the
WebStore
© 2011 Pearson Education, Inc.
Assignments
49Chapter 7
1. All Problems and Exercises.
2. Case Problems
© 2011 Pearson Education, Inc.
Thanks
50Chapter 7