NAVER DEVIEW 2016
TaeungSong
미래부 KOSS LAB. – Software Engineer
taeung@kosslab.kr
2016-10-25
“ 라즈베리파이 , 서버 , IoT 성능 어디까지 쥐어짜봤니 ? ”
Linux Kernel – perf
:a profiler tool with performance events
2.
송태웅 (Taeung Song,https://github.com/taeung)
- 미래창조과학부 KOSS Lab. Software Engineer
- Linux Kernel Contributor 활동 중 (perf)
강의활동
- SK C&C Git/Github 사내 교육영상 제작
- 서강대 , 아주대 , OSS 포럼 등 Git/Github 강의
- 국민대 , 이화여대 등 Linux perf, Opensource 참여 관련 시간강사 활동
Speaker DEVIEW 2016
3.
1. 리눅스의 커널과관련된 성능문제 어떻게 Troubleshooting ?
2. IoT, Embedded 환경 C/C++ program 성능개선작전
Points
4.
1. 리눅스 성능분석도구perf 소개
2. 커널관련 성능문제 Troubleshooting (Cassandra 와 Kernel version)
3. perf 의 Events Sampling 은 어떻게 동작하는가 ?
4. Raspberry pi 환경 C/C++ program 성능개선작전 (ioT, Embedded)
Contents
개발자 입장에서 top,iperf, iotop 의 한계
●
결과적인 CPU 점유율만 표시
●
시간당 데이터처리량만 표시
●
I/O 발생 정도만 확인 가능
●
어떤 소스라인 / 함수 가 병목지점인지 알수 없음
●
Disk/Network I/O 가 심하다면 상세한 진단 불가능
19.
그런데 perf 에서는각종 event 중에서
System Layer 상에서 원하는 성능분석 지점 (Focus) 을 선택가능
●
CPU cycles 중심 성능분석
●
Block Device 레벨 성능분석
●
File System(ext4) 레벨 성능분석
●
Socket 레벨 성능분석
●
Ethernet (NIC) 레벨 성능분석
●
...
20.
System Layer 상에서원하는 성능분석 지점 (Focus) 을 선택가능
CPU Memory Devices Disks Network
Application
Library (Glibc)
System Call Interface
Processes
VM
Device
Driver
VFS Sockets
Threads FileSystem TCP/UDP
Scheduler VolumeManager IP
Arch Block Device Ethernet
SRAM
http://www.makelinux.net/kernel_map/
http://www.brendangregg.com/perf.html
UserKernelHW
< Linux kernel 의 주요 5 가지 subsystem 기준 >
1) 프로세스 관리 (Process management)
2) 메모리 관리 (Memory management)
3) 디바이스 드라이버 (Device Driver)
4) 파일 시스템 (File System)
5) 네트워킹 (Networking)
• Profiling :병목지점 (Bottlenecks) 을 찾아내기 위해
perf 의 사용목적 ?
26.
• Profiling :병목지점 (Bottlenecks) 을 찾아내기 위해
...
21 int foo ( int a, int b)
22 {
23 ...
24
25
26 }
27
28
29
30
31
32
33
...
소스코드 program.c
perf 의 사용목적 ?
27.
• 프로그램 전체에서어떤함수가 CPU 를 많이 사용하는지 ?
• Profiling : 병목지점 (Bottlenecks) 을 찾아내기 위해
...
21 int foo ( int a, int b)
22 {
23 ...
24
25
26 }
27
28
29
30
31
32
33
...
소스코드 program.c
perf 의 사용목적 ?
28.
• 프로그램 전체에서어떤함수가 CPU 를 많이 사용하는지 ?
• 소스코드에서 어떤 라인이 CPU 를 많이 사용하는지 ?
• Profiling : 병목지점 (Bottlenecks) 을 찾아내기 위해
...
21 int foo ( int a, int b)
22 {
23 ...
24
25
26 }
27
28
29
30
31
32
33
...
소스코드 program.c
perf 의 사용목적 ?
29.
• 프로그램 전체에서어떤함수가 CPU 를 많이 사용하는지 ?
• 소스코드에서 어떤 라인이 CPU 를 많이 사용하는지 ?
• Profiling : 병목지점 (Bottlenecks) 을 찾아내기 위해
...
21 int foo ( int a, int b)
22 {
23 ...
24
25
26 }
27
28
29
30
31
32
33
...
소스코드 program.c
HW / SW Events
perf 의 사용목적 ?
30.
• 프로그램 전체에서어떤함수가 CPU 를 많이 사용하는지 ?
• 소스코드에서 어떤 라인이 CPU 를 많이 사용하는지 ?
• Profiling : 병목지점 (Bottlenecks) 을 찾아내기 위해
...
21 int foo ( int a, int b)
22 {
23 ...
24
25
26 }
27
28
29
30
31
32
33
...
소스코드 program.c
HW / SW Events (CPU cycles, cache-misses ...)
perf 의 사용목적 ?
31.
• Tracing :특정 Event 발생에 대한 경위 ,
과정 (function call graph) 을 살펴보기 위해
perf 의 사용목적 ?
32.
• Tracing :특정 Event 발생에 대한 경위 ,
과정 (function call graph) 을 수색하기 위해
• 특정 커널 함수가 왜 불려 졌을까 ?
perf 의 사용목적 ?
33.
• Tracing :특정 Event 발생에 대한 경위 ,
과정 (function call graph) 을 수색하기 위해
• 특정 커널 함수가 왜 불려 졌을까 ?
• 그 커널함수가 호출된 (mapping 된 event 가 발생된 ) 과정 (call graph) 어땠을까 ?
perf 의 사용목적 ?
34.
• Tracing :특정 Event 발생에 대한 경위 ,
과정 (function call graph) 을 수색하기 위해
• 특정 커널 함수가 왜 불려 졌을까 ?
• 그 커널함수가 호출된 (mapping 된 event 가 발생된 ) 과정 (call graph) 어땠을까 ?
Tracepoint / Probe Events
perf 의 사용목적 ?
35.
• Tracing :특정 Event 발생에 대한 경위 ,
과정 (function call graph) 을 수색하기 위해
• 특정 커널 함수가 왜 불려 졌을까 ?
• 그 커널함수가 호출된 (mapping 된 event 가 발생된 ) 과정 (call graph) 어땠을까 ?
Tracepoint / Probe Events ( 여러 커널함수 , system calls, page fault ...)
perf 의 사용목적 ?
36.
Chrome 에서 파일업로드 하는 동안
block_rq_insert 이벤트가 발생되기까지의 과정 (call graph) 수색하면 ?
37.
Chrome 에서 파일업로드 하는 동안
block_rq_insert 이벤트가 발생되기까지의 과정 (call graph) 수색하면 ?
Tracepoint Events
38.
Chrome 에서 파일업로드 하는 동안
block_rq_insert 이벤트가 발생되기까지의 과정 (call graph) 수색하면 ?
…
- 0.36% 0.36% 8,0 R 0 () 483479880 + 56 [chrome]
page_fault
do_page_fault
__do_page_fault
handle_mm_fault
__do_fault
filemap_fault
__do_page_cache_readahead
blk_finish_plug
blk_flush_plug_list
__elv_add_request
+ 0.36% 0.36% 8,0 R 0 () 483479960 + 8 [chrome]
...
39.
…
- 0.36% 0.36%8,0 R 0 () 483479880 + 56 [chrome]
page_fault
do_page_fault
__do_page_fault
handle_mm_fault
__do_fault
filemap_fault
__do_page_cache_readahead
blk_finish_plug
blk_flush_plug_list
__elv_add_request
+ 0.36% 0.36% 8,0 R 0 () 483479960 + 8 [chrome]
...
chrome 이 block_rq_insert 이벤트를 발생시킴 (block I/O 요청 )
(== 커널함수 __elv_add_request 호출함 Read 목적으로 )
Chrome 에서 파일 업로드 하는 동안
block_rq_insert 이벤트가 발생되기까지의 과정 (call graph) 수색하면 ?
40.
…
- 0.36% 0.36%8,0 R 0 () 483479880 + 56 [chrome]
page_fault
do_page_fault
__do_page_fault
handle_mm_fault
__do_fault
filemap_fault
__do_page_cache_readahead
blk_finish_plug
blk_flush_plug_list
__elv_add_request
+ 0.36% 0.36% 8,0 R 0 () 483479960 + 8 [chrome]
...
chrome 이 block_rq_insert 이벤트를 발생시킴 (block I/O 요청 )
(== 커널함수 __elv_add_request 호출함 Read 목적으로 )
Chrome 에서 파일 업로드 하는 동안
block_rq_insert 이벤트가 발생되기까지의 과정 (call graph) 수색하면 ?
Tracepoint Events
41.
…
- 0.36% 0.36%8,0 R 0 () 483479880 + 56 [chrome]
page_fault
do_page_fault
__do_page_fault
handle_mm_fault
__do_fault
filemap_fault
__do_page_cache_readahead
blk_finish_plug
blk_flush_plug_list
__elv_add_request
+ 0.36% 0.36% 8,0 R 0 () 483479960 + 8 [chrome]
...
Chrome 에서 파일 업로드 하는 동안
block_rq_insert 이벤트가 발생되기까지의 과정 (call graph) 수색하면 ?
왜 __elv_add_request 가 호출이 되었나 ?
경위를 찾아 거슬러 올라가보면 ..
42.
…
- 0.36% 0.36%8,0 R 0 () 483479880 + 56 [chrome]
page_fault
do_page_fault
__do_page_fault
handle_mm_fault
__do_fault
filemap_fault
__do_page_cache_readahead
blk_finish_plug
blk_flush_plug_list
__elv_add_request
+ 0.36% 0.36% 8,0 R 0 () 483479960 + 8 [chrome]
...
chrome 이 Block I/O 를 요청 (block_rq_insert 이벤트 발생시킨 ) 한 이유
: page fault 가 발생 했기 때문에 실제 Read 를 요청 했다 .
Chrome 에서 파일 업로드 하는 동안
block_rq_insert 이벤트가 발생되기까지의 과정 (call graph) 수색하면 ?
문제상황 : 커널버전업그레이드 이후
DISK I/O 가 많아짐 , iowait 도 높아짐
어디부터 봐야할까 ?
47.
문제상황 : 커널버전업그레이드 이후
DISK I/O 가 많아짐 , iowait 도 높아짐
User Kernel HW (DISK)
48.
문제상황 : 커널버전업그레이드 이후
DISK I/O 가 많아짐 , iowait 도 높아짐
Kernel HW (DISK)User
49.
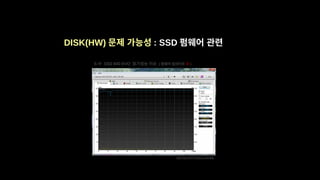
DISK(HW) 문제 가능성: SSD 펌웨어 관련
S 사 SSD 840 EVO 읽기성능 이슈 ( 펌웨어 업데이트 전 )
http://dsct1472.tistory.com/405
50.
DISK(HW) 문제 가능성: SSD 펌웨어 관련
S 사 SSD 840 EVO 읽기성능 이슈 ( 펌웨어 업데이트 후 )
http://dsct1472.tistory.com/405
51.
DISK(HW) 문제 가능성: Smartctl 등을 활용한 간단한 확인
smartctl -a /dev/sda | grep SATA
SATA Version is: SATA 3.1, 6.0 Gb/s (current: 6.0 Gb/s)
52.
smartctl -a /dev/sda| grep SATA
SATA Version is: SATA 3.1, 6.0 Gb/s (current: 6.0 Gb/s)
6.0 Gb -> 750MB
:> dd if=/dev/zero of=testfile bs=1M count=1024
1024+0 records in
1024+0 records out
1073741824 bytes (1.1 GB, 1.0 GiB) copied, 1.41711 s, 758 MB/s
DISK(HW) 문제 가능성 : Smartctl 등을 활용한 간단한 확인
Cassandra 동작중에 ..
block_rq_insert이벤트가 발생되기까지의 과정 (call graph) 수색하면 ?
cassandra 가 block_rq_insert 이벤트를 발생 (block I/O 요청 ) 시키는
이유가 page fault, readahead 등과 관련된거 였다 ..
테스트 당시 Ubuntu 환경
●
Page size: 2MB direct-mapped pages;
huge pages ( 이전 환경 : 4KB)
●
Readahead size: 2048KB ( 이전환경 : 128KB)
# perf record -g -e block:block_rq_insert -p <pid> && perf report
…
- 13.41% 13.41% 202,16 R 0 () 1431480000 + 8 [java]
page_fault
do_page_fault
handle_mm_fault
handle_pte_fault
__do_fault
filemap_fault
do_sync_mmap_readahead.isra.24
ra_submit
__do_page_cache_readahead
read_pages
xfs_vm_readpages
mpage_readpages
do_mpage_readpage
submit_bio
generic_make_request
generic_make_request.part.50
blk_queue_bio
blk_flush_plug_list
+ 12.32% 12.32% 202,16 R 0 () 1431480024 + 32 [java]
...
69.
I/O 요청의 원인page fault, read pages, readahead 와
관련된거라면 ..
70.
I/O 요청의 원인page fault, read pages, readahead 와
관련된거라면 ..
submit_io 는 몇번 불리고 ?
filemap_fault 는 몇번이나 불리는가 ?
71.
# perf probe--add submit_bio
Added new event:
probe:submit_bio (on submit_bio)
You can now use it in all perf tools, such as:
perf record -e probe:submit_bio -aR sleep 1
동적으로 특정 커널함수 probe events 로 지정
72.
# perf probe--add filemap_fault
Added new event:
probe:filemap_fault (on filemap_fault)
You can now use it in all perf tools, such as:
perf record -e probe:filemap_fault -aR sleep 1
동적으로 특정 커널함수 probe events 로 지정
# perf stat-e probe:submit_bio,probe:filemap_fault
...
27881 probe:submit_bio
2203 probe:filemap_fault
…
왜 filemap_fault 보다 submit_bio 가 더 많이 부릴까 ? 거의 10 배 차이로
Filemap Fault 로가져와야할 page 가 많으니까 ..
왜 많은가 ?
테스트 당시 Ubuntu 환경
●
Page size: 2MB direct-mapped pages;
huge pages ( 이전 환경 : 4KB)
●
Readahead size: 2048KB ( 이전환경 : 128KB)
78.
uftrace: A functiongraph tracer
for C/C++ userspace programs
https://github.com/namhyung/uftrace
https://github.com/CppCon/CppCon2016/blob/master/Posters/uftrace%20-
%20A%20function%20graph%20tracer%20for%20userspace
%20programs/uftrace%20-%20A%20function%20graph%20tracer%20for
%20userspace%20programs%20-%20Namhyung%20Kim%20and
%20Honggyu%20Kim%20-%20CppCon%202016.pdf
79.
# uftrace record-K5 -F filemap_fault@kernel
...
# uftrace replay -k -D5
[13289] | filemap_fault() {
[13289] | pagecache_get_page() {
0.244 us [13289] | find_get_entry();
0.614 us [13289] | } /* pagecache_get_page */
0.170 us [13289] | max_sane_readahead();
[13289] | __do_page_cache_readahead() {
[13289] | __page_cache_alloc() {
2.162 us [13289] | alloc_pages_current();
2.531 us [13289] | } /* __page_cache_alloc */
...
[13289] | wait_on_page_bit_killable() {
89.298 us [13289] | __wait_on_bit();
89.685 us [13289] | } /* wait_on_page_bit_killable */
90.393 us [13289] | } /* __lock_page_or_retry */
0.222 us [13289] | put_page();
112.220 us [13289] | } /* filemap_fault */
80.
# uftrace record-K5 -F filemap_fault@kernel
...
# uftrace replay -k -D5
[13289] | filemap_fault() {
[13289] | pagecache_get_page() {
0.244 us [13289] | find_get_entry();
0.614 us [13289] | } /* pagecache_get_page */
0.170 us [13289] | max_sane_readahead();
[13289] | __do_page_cache_readahead() {
[13289] | __page_cache_alloc() {
2.162 us [13289] | alloc_pages_current();
2.531 us [13289] | } /* __page_cache_alloc */
...
[13289] | wait_on_page_bit_killable() {
89.298 us [13289] | __wait_on_bit();
89.685 us [13289] | } /* wait_on_page_bit_killable */
90.393 us [13289] | } /* __lock_page_or_retry */
0.222 us [13289] | put_page();
112.220 us [13289] | } /* filemap_fault */
81.
# perf probe-e probe:__do_page_cache_readahead
...
java-8714 [000] 13445354.703793: probe:__do_page_cache_readahead: (0x0/0x180) nr_to_read=200
java-8716 [002] 13445354.819645: probe:__do_page_cache_readahead: (0x0/0x180) nr_to_read=200
java-8734 [001] 13445354.820965: probe:__do_page_cache_readahead: (0x0/0x180) nr_to_read=200
java-8709 [000] 13445354.825280: probe:__do_page_cache_readahead: (0x0/0x180) nr_to_read=200
...
0x200 = 512 Pages * 4KB = 2048KB
readahead 값 변경 후에도 변화가 없는 문제 ..
Events Sampling 원리
1.perf_event_open() 시스템 콜을 하게 되면 (file descriptor 리턴 )
2. 성능정보 측정 할 수 있는 file descriptor 로 각각의 event 들과 연결
( 동시에 여러이벤트들을 수집가능하게 Grouping 가능 )
3. 각 event 들을 enable or disable 한다 (by ioctl() / prctl())
Userspace Kernel Hardware
perf commands
# perf record XX
# perf-stat XX
# perf top XX
mmapped
pages
SW event handler
PMU
Ftrace events
Kprobes
enable/disable
(SW events)
(HW events)
(Tracepoint events)
(Probepoint events)
perf_event_open()
참조 : http://events.linuxfoundation.org/sites/events/files/lcjp13_takata.pdf
87.
4. counting :event 들이 발생횟수를 누적하여 센다 .
5. sampling : 측정 정보를 버퍼에 쓴다 (mmap() 로 받을 준비를 한뒤 ,
특정이벤트 발생시 (interrupt) 매번 수집 또는 지정된 특정 주기로 수집 )
6. perf command 가 mmap() 을 통해서 성능정보 수집 (kernel 에서 user 의 copying 없이 )
Userspace Kernel Hardware
perf commands
# perf record XX
# perf-stat XX
# perf top XX
mmapped
pages
perf core
samples
SW events
Timer interupt
page fault etc.
context switch
CPU migration etc.
Trace events
Prove events
HW events
mmap()
참조 : http://events.linuxfoundation.org/sites/events/files/lcjp13_takata.pdf
Events Sampling 원리
88.
내 개발환경에 perf를 어떻게 적용시킬까 ?
각종 유용한 Event 소개
* 참고
# perf 설치하기
# sudo apt-get install linux-tools-common linux-generic
# perf 사용법 익히기
http://www.brendangregg.com/perf.html
kernel version :4.2.0-27-generic
perf version : 4.5.rc2.ga7636d9
CPU : Intel® Core(TM) i7-5500U CPU @ 2.40GHz
CPU Memory Devices Disks Network
Application
Library (Glibc)
System Call Interface
Processes
VM
Device
Driver
VFS Sockets
Threads FileSystem TCP/UDP
Scheduler VolumeManager IP
Arch Block Device Ethernet
SRAM
UserKernelHW
(HW event)
- cycles : CPU 클럭 싸이클 수
- instructions : 실행한 명령어의 개수
- branch-instructions : 실행한 분기명령의 개수
- branch-misses : 분기예측 (branch prediction) 의 실패 수
Events on CPU
91.
kernel version :4.2.0-27-generic
perf version : 4.5.rc2.ga7636d9
CPU : Intel® Core(TM) i7-5500U CPU @ 2.40GHz
CPU Memory Devices Disks Network
Application
Library (Glibc)
System Call Interface
Processes
VM
Device
Driver
VFS Sockets
Threads FileSystem TCP/UDP
Scheduler VolumeManager IP
Arch Block Device Ethernet
SRAM
UserKernelHW
(HW cache event)
- L1-dcache-load-misses : 데이터 캐시 로드 실패 수
- L1-dcache-loads : 데이터 캐시 로드 실패 수
- L1-icache-load-misses : 명령어 캐시 로드 실패 수
(LLC : Last Level Cache ; CPU 와 가장 멀리있는 캐시 )
- LLC-loads, LLC-load-misses : LLC 로드 관련
- LLC-stores, LLC-store-misses : LLC 저장 관련
Events on SRAM
92.
kernel version :4.2.0-27-generic
perf version : 4.5.rc2.ga7636d9
CPU : Intel® Core(TM) i7-5500U CPU @ 2.40GHz
CPU Memory Devices Disks Network
Application
Library (Glibc)
System Call Interface
Processes
VM
Device
Driver
VFS Sockets
Threads FileSystem TCP/UDP
Scheduler VolumeManager IP
Arch Block Device Ethernet
SRAM
UserKernelHW
(HW cache event)
- branch-loads, branch-load-misses : branch prediction unit 관련
(TLB: Translation lookaside buffer; 가상 메모리 주소를 위한 캐시 )
- dTLB-loads, dTLB-load-misses : 데이터 TLB 로드 관련
- dTLB-stores, dTLB-store-misses : 데이터 TLB 저장 관련
- iTLB-loads, iTLB-load-misses : 명령어 TLB 로드 관련
- node-loads, node-load-misses : 로컬 메모리 로드 관련
- node-stores, node-store-misses : 로컬 메모리 저장 관련
Events on SRAM
93.
Events on Memory
kernelversion : 4.2.0-27-generic
perf version : 4.5.rc2.ga7636d9
CPU : Intel® Core(TM) i7-5500U CPU @ 2.40GHz
CPU Memory Devices Disks Network
Application
Library (Glibc)
System Call Interface
Processes
VM
Device
Driver
VFS Sockets
Threads FileSystem TCP/UDP
Scheduler VolumeManager IP
Arch Block Device Ethernet
SRAM
UserKernelHW
(Kernel PMU event)
- mem-loads : 메모리로 부터 cpu 로 데이터 / 명령어 가져오는 횟수
- mem-stores : cpu 의 레지스터 (ex. AC ( 누산기 , Acummulator)) 로 부터 데이터를 메모리에 저장하는 횟수
94.
Events for SystemCalls
kernel version : 4.2.0-27-generic
perf version : 4.5.rc2.ga7636d9
CPU : Intel® Core(TM) i7-5500U CPU @ 2.40GHz
CPU Memory Devices Disks Network
Application
Library (Glibc)
System Call Interface
Processes
VM
Device
Driver
VFS Sockets
Threads FileSystem TCP/UDP
Scheduler VolumeManager IP
Arch Block Device Ethernet
SRAM
UserKernelHW
(Tracepoint event)
- syscalls: 각종 시스템 콜이 호출 (sys_enter_*) 되고 수행이 끝나는 (sys_exit_*) point 를 확인한다 .
어떤 코드부분에서 얼마나 불려졌는지를 확인 할 수 있다 .
시스템콜은 300 가지 정도 확인이 가능하다 . (perf version 4.5.rc2 기준 )
95.
Events for Scheduler
kernelversion : 4.2.0-27-generic
perf version : 4.5.rc2.ga7636d9
CPU : Intel® Core(TM) i7-5500U CPU @ 2.40GHz
CPU Memory Devices Disks Network
Application
Library (Glibc)
System Call Interface
Processes
VM
Device
Driver
VFS Sockets
Threads FileSystem TCP/UDP
Scheduler VolumeManager IP
Arch Block Device Ethernet
SRAM
UserKernelHW (Tracepoint event)
- sched: 스케줄링 관련
- signal: 시그널 생성 및 전달 관련
- workqueue: 워크큐가 언제 시작되고 끝났는지 현재 active 한 작업 관련 확인가능
- task: 새로운 테스트가 생성 되었는지 또는 이름이 변경 되었는지 확인가능
- timer: 타이머의 상태 초기화 등 관련 정보 확인
96.
kernel version :4.2.0-27-generic
perf version : 4.5.rc2.ga7636d9
CPU : Intel® Core(TM) i7-5500U CPU @ 2.40GHz
CPU Memory Devices Disks Network
Application
Library (Glibc)
System Call Interface
Processes
VM
Device
Driver
VFS Sockets
Threads FileSystem TCP/UDP
Scheduler VolumeManager IP
Arch Block Device Ethernet
SRAM
UserKernelHW
(Software event)
- cpu-clock: perf 가 record, stat 하는 등의 수행시간을 cpu 시간 단위로 확인 (msec 단위 )
- migrations: cpu migration – context-switch: 컨택스트 스위치
Events for Scheduler
97.
Events for VirtualMemory
kernel version : 4.2.0-27-generic
perf version : 4.5.rc2.ga7636d9
CPU : Intel® Core(TM) i7-5500U CPU @ 2.40GHz
CPU Memory Devices Disks Network
Application
Library (Glibc)
System Call Interface
Processes
VM
Device
Driver
VFS Sockets
Threads FileSystem TCP/UDP
Scheduler VolumeManager IP
Arch Block Device Ethernet
SRAM
UserKernelHW
(Tracepoint event)
- vmscan: page reclaim ( 회수 ) 가 언제시작되고 끝났는지 등을 확인 가능
– kmem: kmalloc, page_alloc 등을 확인 가능 - writeback: writeback 관련 event 확인 가능
98.
kernel version :4.2.0-27-generic
perf version : 4.5.rc2.ga7636d9
CPU : Intel® Core(TM) i7-5500U CPU @ 2.40GHz
CPU Memory Devices Disks Network
Application
Library (Glibc)
System Call Interface
Processes
VM
Device
Driver
VFS Sockets
Threads FileSystem TCP/UDP
Scheduler VolumeManager IP
Arch Block Device Ethernet
SRAM
UserKernelHW
(Software event)
- page-faults : 페이지폴트 발생이 어디서 얼마나 났는지 확인 가능
- minor-faults: I/O 발생없이 MMU 만 로드정보를 없을때의 페이지폴트 관련
- major-faults : Disk I/O 발생이 필요한 페이지폴트 관련
Events for Virtual Memory
99.
Events for DeviceDriver
kernel version : 4.2.0-27-generic
perf version : 4.5.rc2.ga7636d9
CPU : Intel® Core(TM) i7-5500U CPU @ 2.40GHz
CPU Memory Devices Disks Network
Application
Library (Glibc)
System Call Interface
Processes
VM
Device
Driver
VFS Sockets
Threads FileSystem TCP/UDP
Scheduler VolumeManager IP
Arch Block Device Ethernet
SRAM
UserKernelHW
(Tracepoint event)
- scsi: 해당 기기에 명령이 오류가 났는지 수행이 끝났는지 등을 확인 가능 하다 .
(Small Computer System Interface)
- irq: 인터럽트 핸들링 , 인터럽트 백터 관련한 작업을 확인 가능하다 .
100.
Events for BlockDevice
kernel version : 4.2.0-27-generic
perf version : 4.5.rc2.ga7636d9
CPU : Intel® Core(TM) i7-5500U CPU @ 2.40GHz
CPU Memory Devices Disks Network
Application
Library (Glibc)
System Call Interface
Processes
VM
Device
Driver
VFS Sockets
Threads FileSystem TCP/UDP
Scheduler VolumeManager IP
Arch Block Device Ethernet
SRAM
UserKernelHW
(Tracepoint event)
- block: 블록 I/O 관련 하여 request 가 완료됬는지 혹은 취소됬는지
언제 어디서 됬는지를 확인 할 수 있다 .


![Chrome 에서 파일 업로드 하는 동안
block_rq_insert 이벤트가 발생되기까지의 과정 (call graph) 수색하면 ?
…
- 0.36% 0.36% 8,0 R 0 () 483479880 + 56 [chrome]
page_fault
do_page_fault
__do_page_fault
handle_mm_fault
__do_fault
filemap_fault
__do_page_cache_readahead
blk_finish_plug
blk_flush_plug_list
__elv_add_request
+ 0.36% 0.36% 8,0 R 0 () 483479960 + 8 [chrome]
...](/proxy?url=https%3A%2F%2Fimage.slidesharecdn.com%2F232-161025013504%2F85%2F232-38-320.jpg)
![…
- 0.36% 0.36% 8,0 R 0 () 483479880 + 56 [chrome]
page_fault
do_page_fault
__do_page_fault
handle_mm_fault
__do_fault
filemap_fault
__do_page_cache_readahead
blk_finish_plug
blk_flush_plug_list
__elv_add_request
+ 0.36% 0.36% 8,0 R 0 () 483479960 + 8 [chrome]
...
chrome 이 block_rq_insert 이벤트를 발생시킴 (block I/O 요청 )
(== 커널함수 __elv_add_request 호출함 Read 목적으로 )
Chrome 에서 파일 업로드 하는 동안
block_rq_insert 이벤트가 발생되기까지의 과정 (call graph) 수색하면 ?](/proxy?url=https%3A%2F%2Fimage.slidesharecdn.com%2F232-161025013504%2F85%2F232-39-320.jpg)
![…
- 0.36% 0.36% 8,0 R 0 () 483479880 + 56 [chrome]
page_fault
do_page_fault
__do_page_fault
handle_mm_fault
__do_fault
filemap_fault
__do_page_cache_readahead
blk_finish_plug
blk_flush_plug_list
__elv_add_request
+ 0.36% 0.36% 8,0 R 0 () 483479960 + 8 [chrome]
...
chrome 이 block_rq_insert 이벤트를 발생시킴 (block I/O 요청 )
(== 커널함수 __elv_add_request 호출함 Read 목적으로 )
Chrome 에서 파일 업로드 하는 동안
block_rq_insert 이벤트가 발생되기까지의 과정 (call graph) 수색하면 ?
Tracepoint Events](/proxy?url=https%3A%2F%2Fimage.slidesharecdn.com%2F232-161025013504%2F85%2F232-40-320.jpg)
![…
- 0.36% 0.36% 8,0 R 0 () 483479880 + 56 [chrome]
page_fault
do_page_fault
__do_page_fault
handle_mm_fault
__do_fault
filemap_fault
__do_page_cache_readahead
blk_finish_plug
blk_flush_plug_list
__elv_add_request
+ 0.36% 0.36% 8,0 R 0 () 483479960 + 8 [chrome]
...
Chrome 에서 파일 업로드 하는 동안
block_rq_insert 이벤트가 발생되기까지의 과정 (call graph) 수색하면 ?
왜 __elv_add_request 가 호출이 되었나 ?
경위를 찾아 거슬러 올라가보면 ..](/proxy?url=https%3A%2F%2Fimage.slidesharecdn.com%2F232-161025013504%2F85%2F232-41-320.jpg)
![…
- 0.36% 0.36% 8,0 R 0 () 483479880 + 56 [chrome]
page_fault
do_page_fault
__do_page_fault
handle_mm_fault
__do_fault
filemap_fault
__do_page_cache_readahead
blk_finish_plug
blk_flush_plug_list
__elv_add_request
+ 0.36% 0.36% 8,0 R 0 () 483479960 + 8 [chrome]
...
chrome 이 Block I/O 를 요청 (block_rq_insert 이벤트 발생시킨 ) 한 이유
: page fault 가 발생 했기 때문에 실제 Read 를 요청 했다 .
Chrome 에서 파일 업로드 하는 동안
block_rq_insert 이벤트가 발생되기까지의 과정 (call graph) 수색하면 ?](/proxy?url=https%3A%2F%2Fimage.slidesharecdn.com%2F232-161025013504%2F85%2F232-42-320.jpg)





![deadline 에서 noop 으로 변경 실험
# cat /sys/block/sda/queue/scheduler
noop [deadline] cfq
# echo deadline > /sys/block/sda/queue/scheduler
# cat /sys/block/sda/queue/scheduler
[noop] deadline cfq](/proxy?url=https%3A%2F%2Fimage.slidesharecdn.com%2F232-161025013504%2F85%2F232-61-320.jpg)

![# perf record -g -e block:block_rq_insert -p <pid> && perf report
…
- 13.41% 13.41% 202,16 R 0 () 1431480000 + 8 [java]
page_fault
do_page_fault
handle_mm_fault
handle_pte_fault
__do_fault
filemap_fault
do_sync_mmap_readahead.isra.24
ra_submit
__do_page_cache_readahead
read_pages
xfs_vm_readpages
mpage_readpages
do_mpage_readpage
submit_bio
generic_make_request
generic_make_request.part.50
blk_queue_bio
blk_flush_plug_list
+ 12.32% 12.32% 202,16 R 0 () 1431480024 + 32 [java]
...
Cassandra 동작중에 ..
block_rq_insert 이벤트가 발생되기까지의 과정 (call graph) 수색하면 ?](/proxy?url=https%3A%2F%2Fimage.slidesharecdn.com%2F232-161025013504%2F85%2F232-63-320.jpg)
![# perf record -g -e block:block_rq_insert -p <pid> && perf report
…
- 13.41% 13.41% 202,16 R 0 () 1431480000 + 8 [java]
page_fault
do_page_fault
handle_mm_fault
handle_pte_fault
__do_fault
filemap_fault
do_sync_mmap_readahead.isra.24
ra_submit
__do_page_cache_readahead
read_pages
xfs_vm_readpages
mpage_readpages
do_mpage_readpage
submit_bio
generic_make_request
generic_make_request.part.50
blk_queue_bio
blk_flush_plug_list
+ 12.32% 12.32% 202,16 R 0 () 1431480024 + 32 [java]
...
Cassandra 동작중에 ..
block_rq_insert 이벤트가 발생되기까지의 과정 (call graph) 수색하면 ?](/proxy?url=https%3A%2F%2Fimage.slidesharecdn.com%2F232-161025013504%2F85%2F232-64-320.jpg)
![# perf record -g -e block:block_rq_insert -p <pid> && perf report
…
- 13.41% 13.41% 202,16 R 0 () 1431480000 + 8 [java]
page_fault
do_page_fault
handle_mm_fault
handle_pte_fault
__do_fault
filemap_fault
do_sync_mmap_readahead.isra.24
ra_submit
__do_page_cache_readahead
read_pages
xfs_vm_readpages
mpage_readpages
do_mpage_readpage
submit_bio
generic_make_request
generic_make_request.part.50
blk_queue_bio
blk_flush_plug_list
+ 12.32% 12.32% 202,16 R 0 () 1431480024 + 32 [java]
...
Cassandra 동작중에 ..
block_rq_insert 이벤트가 발생되기까지의 과정 (call graph) 수색하면 ?](/proxy?url=https%3A%2F%2Fimage.slidesharecdn.com%2F232-161025013504%2F85%2F232-65-320.jpg)
![# perf record -g -e block:block_rq_insert -p <pid> && perf report
…
- 13.41% 13.41% 202,16 R 0 () 1431480000 + 8 [java]
page_fault
do_page_fault
handle_mm_fault
handle_pte_fault
__do_fault
filemap_fault
do_sync_mmap_readahead.isra.24
ra_submit
__do_page_cache_readahead
read_pages
xfs_vm_readpages
mpage_readpages
do_mpage_readpage
submit_bio
generic_make_request
generic_make_request.part.50
blk_queue_bio
blk_flush_plug_list
+ 12.32% 12.32% 202,16 R 0 () 1431480024 + 32 [java]
...
Cassandra 동작중에 ..
block_rq_insert 이벤트가 발생되기까지의 과정 (call graph) 수색하면 ?](/proxy?url=https%3A%2F%2Fimage.slidesharecdn.com%2F232-161025013504%2F85%2F232-66-320.jpg)
![# perf record -g -e block:block_rq_insert -p <pid> && perf report
…
- 13.41% 13.41% 202,16 R 0 () 1431480000 + 8 [java]
page_fault
do_page_fault
handle_mm_fault
handle_pte_fault
__do_fault
filemap_fault
do_sync_mmap_readahead.isra.24
ra_submit
__do_page_cache_readahead
read_pages
xfs_vm_readpages
mpage_readpages
do_mpage_readpage
submit_bio
generic_make_request
generic_make_request.part.50
blk_queue_bio
blk_flush_plug_list
+ 12.32% 12.32% 202,16 R 0 () 1431480024 + 32 [java]
...
Cassandra 동작중에 ..
block_rq_insert 이벤트가 발생되기까지의 과정 (call graph) 수색하면 ?
cassandra 가 block_rq_insert 이벤트를 발생 (block I/O 요청 ) 시키는
이유가 page fault, readahead 등과 관련된거 였다 ..](/proxy?url=https%3A%2F%2Fimage.slidesharecdn.com%2F232-161025013504%2F85%2F232-67-320.jpg)
![Cassandra 동작중에 ..
block_rq_insert 이벤트가 발생되기까지의 과정 (call graph) 수색하면 ?
cassandra 가 block_rq_insert 이벤트를 발생 (block I/O 요청 ) 시키는
이유가 page fault, readahead 등과 관련된거 였다 ..
테스트 당시 Ubuntu 환경
●
Page size: 2MB direct-mapped pages;
huge pages ( 이전 환경 : 4KB)
●
Readahead size: 2048KB ( 이전환경 : 128KB)
# perf record -g -e block:block_rq_insert -p <pid> && perf report
…
- 13.41% 13.41% 202,16 R 0 () 1431480000 + 8 [java]
page_fault
do_page_fault
handle_mm_fault
handle_pte_fault
__do_fault
filemap_fault
do_sync_mmap_readahead.isra.24
ra_submit
__do_page_cache_readahead
read_pages
xfs_vm_readpages
mpage_readpages
do_mpage_readpage
submit_bio
generic_make_request
generic_make_request.part.50
blk_queue_bio
blk_flush_plug_list
+ 12.32% 12.32% 202,16 R 0 () 1431480024 + 32 [java]
...](/proxy?url=https%3A%2F%2Fimage.slidesharecdn.com%2F232-161025013504%2F85%2F232-68-320.jpg)


![# uftrace record -K5 -F filemap_fault@kernel
...
# uftrace replay -k -D5
[13289] | filemap_fault() {
[13289] | pagecache_get_page() {
0.244 us [13289] | find_get_entry();
0.614 us [13289] | } /* pagecache_get_page */
0.170 us [13289] | max_sane_readahead();
[13289] | __do_page_cache_readahead() {
[13289] | __page_cache_alloc() {
2.162 us [13289] | alloc_pages_current();
2.531 us [13289] | } /* __page_cache_alloc */
...
[13289] | wait_on_page_bit_killable() {
89.298 us [13289] | __wait_on_bit();
89.685 us [13289] | } /* wait_on_page_bit_killable */
90.393 us [13289] | } /* __lock_page_or_retry */
0.222 us [13289] | put_page();
112.220 us [13289] | } /* filemap_fault */](/proxy?url=https%3A%2F%2Fimage.slidesharecdn.com%2F232-161025013504%2F85%2F232-79-320.jpg)
![# uftrace record -K5 -F filemap_fault@kernel
...
# uftrace replay -k -D5
[13289] | filemap_fault() {
[13289] | pagecache_get_page() {
0.244 us [13289] | find_get_entry();
0.614 us [13289] | } /* pagecache_get_page */
0.170 us [13289] | max_sane_readahead();
[13289] | __do_page_cache_readahead() {
[13289] | __page_cache_alloc() {
2.162 us [13289] | alloc_pages_current();
2.531 us [13289] | } /* __page_cache_alloc */
...
[13289] | wait_on_page_bit_killable() {
89.298 us [13289] | __wait_on_bit();
89.685 us [13289] | } /* wait_on_page_bit_killable */
90.393 us [13289] | } /* __lock_page_or_retry */
0.222 us [13289] | put_page();
112.220 us [13289] | } /* filemap_fault */](/proxy?url=https%3A%2F%2Fimage.slidesharecdn.com%2F232-161025013504%2F85%2F232-80-320.jpg)
![# perf probe -e probe:__do_page_cache_readahead
...
java-8714 [000] 13445354.703793: probe:__do_page_cache_readahead: (0x0/0x180) nr_to_read=200
java-8716 [002] 13445354.819645: probe:__do_page_cache_readahead: (0x0/0x180) nr_to_read=200
java-8734 [001] 13445354.820965: probe:__do_page_cache_readahead: (0x0/0x180) nr_to_read=200
java-8709 [000] 13445354.825280: probe:__do_page_cache_readahead: (0x0/0x180) nr_to_read=200
...
0x200 = 512 Pages * 4KB = 2048KB
readahead 값 변경 후에도 변화가 없는 문제 ..](/proxy?url=https%3A%2F%2Fimage.slidesharecdn.com%2F232-161025013504%2F85%2F232-81-320.jpg)
![# perf probe -e probe:__do_page_cache_readahead
...
java-8714 [000] 13445354.703793: probe:__do_page_cache_readahead: (0x0/0x180) nr_to_read=200
java-8716 [002] 13445354.819645: probe:__do_page_cache_readahead: (0x0/0x180) nr_to_read=200
java-8734 [001] 13445354.820965: probe:__do_page_cache_readahead: (0x0/0x180) nr_to_read=200
java-8709 [000] 13445354.825280: probe:__do_page_cache_readahead: (0x0/0x180) nr_to_read=200
...
0x200 = 512 Pages * 4KB = 2048KB
vfs_open 발생시 한번만 file_ra_state_init() 로 readahead 값 초기화가 문제](/proxy?url=https%3A%2F%2Fimage.slidesharecdn.com%2F232-161025013504%2F85%2F232-82-320.jpg)
![# perf probe -e probe:__do_page_cache_readahead
...
java-8714 [000] 13445354.703793: probe:__do_page_cache_readahead: (0x0/0x180) nr_to_read=200
java-8716 [002] 13445354.819645: probe:__do_page_cache_readahead: (0x0/0x180) nr_to_read=200
java-8734 [001] 13445354.820965: probe:__do_page_cache_readahead: (0x0/0x180) nr_to_read=200
java-8709 [000] 13445354.825280: probe:__do_page_cache_readahead: (0x0/0x180) nr_to_read=200
...
# perf probe -e probe:
...
java-8714 [000] 13445354.703793: probe:__do_page_cache_readahead: (0x0/0x180) nr_to_read=80
java-8716 [002] 13445354.819645: probe:__do_page_cache_readahead: (0x0/0x180) nr_to_read=80
java-8734 [001] 13445354.820965: probe:__do_page_cache_readahead: (0x0/0x180) nr_to_read=80
java-8709 [000] 13445354.825280: probe:__do_page_cache_readahead: (0x0/0x180) nr_to_read=80
...
0x200 = 512 Pages * 4KB = 2048KB
0x80 = 128 Pages * 4KB = 512KB
Cassandra DB Restart 로 해결](/proxy?url=https%3A%2F%2Fimage.slidesharecdn.com%2F232-161025013504%2F85%2F232-83-320.jpg)


![[MGDC] 리눅스 게임 서버 성능 분석하기 - 아이펀팩토리 김진욱 CTO](/proxy?url=https%3A%2F%2Fcdn.slidesharecdn.com%2Fss_thumbnails%2Fmgdcifunfactoryjinukkim-181018053904-thumbnail.jpg%3Fwidth%3D640%26height%3D640%26fit%3Dbounds)


![[Pgday.Seoul 2017] 2. PostgreSQL을 위한 리눅스 커널 최적화 - 김상욱](/proxy?url=https%3A%2F%2Fcdn.slidesharecdn.com%2Fss_thumbnails%2Fpgday-171106040432-thumbnail.jpg%3Fwidth%3D640%26height%3D640%26fit%3Dbounds)


![[2014 CodeEngn Conference 11] 이경식 - 동적 추적 프레임워크를 이용한 OS X 바이너리 분석](/proxy?url=https%3A%2F%2Fcdn.slidesharecdn.com%2Fss_thumbnails%2F2014codeengnconference11dtrace-141202123836-conversion-gate01-thumbnail.jpg%3Fwidth%3D640%26height%3D640%26fit%3Dbounds)


![[231]운영체제 수준에서의 데이터베이스 성능 분석과 최적화](/proxy?url=https%3A%2F%2Fcdn.slidesharecdn.com%2Fss_thumbnails%2F231-171017003147-thumbnail.jpg%3Fwidth%3D640%26height%3D640%26fit%3Dbounds)


![[211] 인공지능이 인공지능 챗봇을 만든다](/proxy?url=https%3A%2F%2Fcdn.slidesharecdn.com%2Fss_thumbnails%2F211chatbot-181106094835-thumbnail.jpg%3Fwidth%3D640%26height%3D640%26fit%3Dbounds)
![[233] 대형 컨테이너 클러스터에서의 고가용성 Network Load Balancing: Maglev Hashing Scheduler i...](/proxy?url=https%3A%2F%2Fcdn.slidesharecdn.com%2Fss_thumbnails%2F233networkloadbalancing-181018151852-thumbnail.jpg%3Fwidth%3D640%26height%3D640%26fit%3Dbounds)
![[215] Druid로 쉽고 빠르게 데이터 분석하기](/proxy?url=https%3A%2F%2Fcdn.slidesharecdn.com%2Fss_thumbnails%2F215druid-181012071910-thumbnail.jpg%3Fwidth%3D640%26height%3D640%26fit%3Dbounds)
![[245]Papago Internals: 모델분석과 응용기술 개발](/proxy?url=https%3A%2F%2Fcdn.slidesharecdn.com%2Fss_thumbnails%2F245papagointernals1-181012045005-thumbnail.jpg%3Fwidth%3D640%26height%3D640%26fit%3Dbounds)
![[236] 스트림 저장소 최적화 이야기: 아파치 드루이드로부터 얻은 교훈](/proxy?url=https%3A%2F%2Fcdn.slidesharecdn.com%2Fss_thumbnails%2F236deview2018jihoonson-final-181012031726-thumbnail.jpg%3Fwidth%3D640%26height%3D640%26fit%3Dbounds)
![[235]Wikipedia-scale Q&A](/proxy?url=https%3A%2F%2Fcdn.slidesharecdn.com%2Fss_thumbnails%2F235deview2018julienperezwikipediaqa12oct2018-181012030613-thumbnail.jpg%3Fwidth%3D640%26height%3D640%26fit%3Dbounds)
![[244]로봇이 현실 세계에 대해 학습하도록 만들기](/proxy?url=https%3A%2F%2Fcdn.slidesharecdn.com%2Fss_thumbnails%2F244deview2018tomisilanderrobotsrealworldfinal11oct2018-181012024720-thumbnail.jpg%3Fwidth%3D640%26height%3D640%26fit%3Dbounds)
![[243] Deep Learning to help student’s Deep Learning](/proxy?url=https%3A%2F%2Fcdn.slidesharecdn.com%2Fss_thumbnails%2F243deeplearningtohelpstudentsdeeplearning-181012024530-thumbnail.jpg%3Fwidth%3D640%26height%3D640%26fit%3Dbounds)
![[234]Fast & Accurate Data Annotation Pipeline for AI applications](/proxy?url=https%3A%2F%2Fcdn.slidesharecdn.com%2Fss_thumbnails%2F234fastaccuratedataannotationpipelineforaiapplications1-181012024230-thumbnail.jpg%3Fwidth%3D640%26height%3D640%26fit%3Dbounds)
![Old version: [233]대형 컨테이너 클러스터에서의 고가용성 Network Load Balancing](/proxy?url=https%3A%2F%2Fcdn.slidesharecdn.com%2Fss_thumbnails%2F233largecontainerclusternetworkloadbalancing-181012024225-thumbnail.jpg%3Fwidth%3D640%26height%3D640%26fit%3Dbounds)
![[226]NAVER 광고 deep click prediction: 모델링부터 서빙까지](/proxy?url=https%3A%2F%2Fcdn.slidesharecdn.com%2Fss_thumbnails%2F226naveraddeepclickprediction-181012024116-thumbnail.jpg%3Fwidth%3D640%26height%3D640%26fit%3Dbounds)
![[225]NSML: 머신러닝 플랫폼 서비스하기 & 모델 튜닝 자동화하기](/proxy?url=https%3A%2F%2Fcdn.slidesharecdn.com%2Fss_thumbnails%2F225nsmlmachinelearningntuningautomize-181012023407-thumbnail.jpg%3Fwidth%3D640%26height%3D640%26fit%3Dbounds)
![[224]네이버 검색과 개인화](/proxy?url=https%3A%2F%2Fcdn.slidesharecdn.com%2Fss_thumbnails%2F224naversearchnpersonalizationfinal-181012022631-thumbnail.jpg%3Fwidth%3D640%26height%3D640%26fit%3Dbounds)
![[216]Search Reliability Engineering (부제: 지진에도 흔들리지 않는 네이버 검색시스템)](/proxy?url=https%3A%2F%2Fcdn.slidesharecdn.com%2Fss_thumbnails%2F216sresearchreliabilityengineering-181012022623-thumbnail.jpg%3Fwidth%3D640%26height%3D640%26fit%3Dbounds)
![[214] Ai Serving Platform: 하루 수 억 건의 인퍼런스를 처리하기 위한 고군분투기](/proxy?url=https%3A%2F%2Fcdn.slidesharecdn.com%2Fss_thumbnails%2F214aiservingplatforminference-181012022603-thumbnail.jpg%3Fwidth%3D640%26height%3D640%26fit%3Dbounds)
![[213] Fashion Visual Search](/proxy?url=https%3A%2F%2Fcdn.slidesharecdn.com%2Fss_thumbnails%2F213fashionvisualsearchreduced-181012022540-thumbnail.jpg%3Fwidth%3D640%26height%3D640%26fit%3Dbounds)
![[232] TensorRT를 활용한 딥러닝 Inference 최적화](/proxy?url=https%3A%2F%2Fcdn.slidesharecdn.com%2Fss_thumbnails%2F232dlinferenceoptimizationusingtensorrt1-181012014455-thumbnail.jpg%3Fwidth%3D640%26height%3D640%26fit%3Dbounds)
![[242]컴퓨터 비전을 이용한 실내 지도 자동 업데이트 방법: 딥러닝을 통한 POI 변화 탐지](/proxy?url=https%3A%2F%2Fcdn.slidesharecdn.com%2Fss_thumbnails%2F242pcdpublic-181012011734-thumbnail.jpg%3Fwidth%3D640%26height%3D640%26fit%3Dbounds)
![[212]C3, 데이터 처리에서 서빙까지 가능한 하둡 클러스터](/proxy?url=https%3A%2F%2Fcdn.slidesharecdn.com%2Fss_thumbnails%2F212c3-181012011644-thumbnail.jpg%3Fwidth%3D640%26height%3D640%26fit%3Dbounds)
![[223]기계독해 QA: 검색인가, NLP인가?](/proxy?url=https%3A%2F%2Fcdn.slidesharecdn.com%2Fss_thumbnails%2F2232018-181012010149-thumbnail.jpg%3Fwidth%3D640%26height%3D640%26fit%3Dbounds)