[Bug]: ValueError: The 'color' keyword argument must have one color per dataset #30857
Description
Bug summary
We can plot multiple lines in one color with plt.plot, but not with plt.hist.
I'm not sure if this considered as a bug, but I can't understand why hist force this requirement.
Code for reproduction
import matplotlib.pyplot as plt

data = [[0, 1, 2], [3, 4, 5]]

plt.plot(data, color='k')
plt.show()

plt.hist(data, color='k')
Actual outcome
plt.plot works as expected, but plt.hist get the following error
ValueError: The 'color' keyword argument must have one color per dataset, but 2 datasets and 1 colors were provided.
Expected outcome
Just plot the histograms in same color
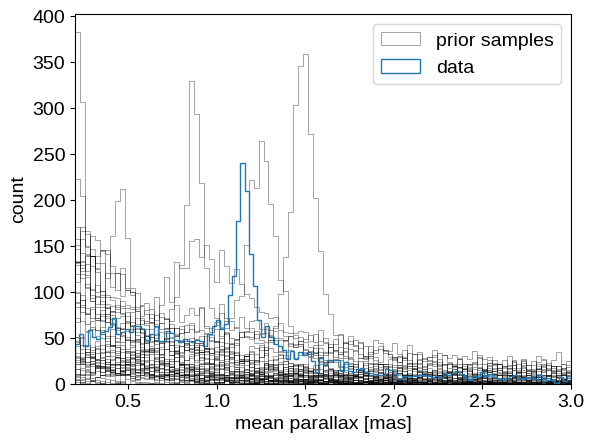
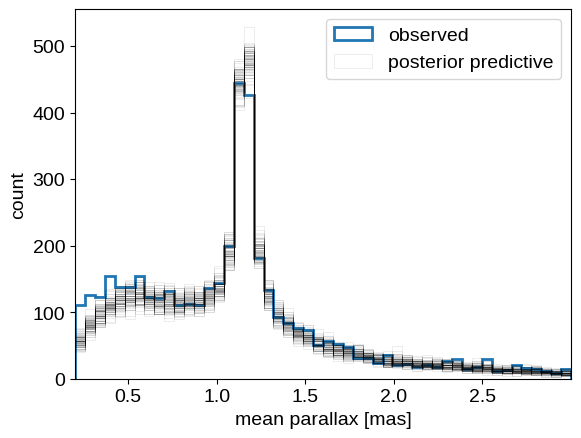
What I want to achieve is
Additional information
No response
Operating system
No response
Matplotlib Version
3.10.8
Matplotlib Backend
No response
Python version
No response
Jupyter version
No response
Installation
None